Concept explainers
Videos
The voltage across a 0.5-mH inductor, Plotted as a function of time, is shown in Figure P4.12. Determine the current through the inductor at
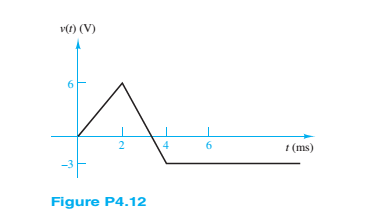
The current through the inductor at
Answer to Problem 4.12HP
The current through the inductor at
Explanation of Solution
Calculation:
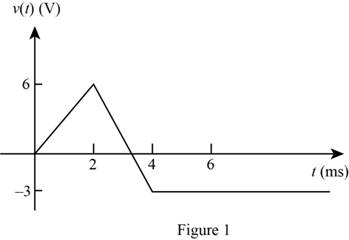
The given diagram is shown in Figure 1
The conversion from
The conversion from
The conversion from
The conversion from
The conversion from
The conversion from
From the graph the expression for the voltage between the points
From the graph the expression for the voltage between the points
From the graph the expression for the voltage at
The expression for the voltage across the inductor is given by,
The initial current through the inductor is given by,
The expression for the current through the inductor is given by,
Substitute
From equation (1) the current through the inductor for the time interval
Substitute
Substitute
From equation (1) the current through the inductor for the time interval
Substitute
Solve further as,
Substitute
The expression for the current through the inductor for interval
Substitute
Substitute
Conclusion:
Therefore, the current through the inductor at
Want to see more full solutions like this?
Chapter 4 Solutions
Principles and Applications of Electrical Engineering


- We know that the capacitor shown in Figure P4.11 is charged to a voltage of 10 V priorto t=0.a. Find expressions for the voltage across the capacitor vC(t) and the voltage across theresistor vR(t) for all time.b. Find an expression for the power delivered to the resistor.c. Integrate the power from t=0 to t=∞ to find the energy delivered.d. Show that the energy delivered to the resistor is equal to the energy stored in thecapacitor prior to t=0.arrow_forwardThe plot of time-dependent voltage is shown inFigure P4.12. The waveform is piecewise continuous.If this is the voltage across a capacitor and C = 80 μF,determine the current through the capacitor. How cancurrent flow “through” a capacitor?arrow_forwardIf the waveform shown in Figure P4.15 is thevoltage across a capacitor plotted as a function of timewithvPK = 20V, T = 40 μs, C = 680nFdetermine and plot the waveform for the currentthrough the capacitor as a function of time.arrow_forward
- For the circuit shown in Figure (4.a): i) Find the voltage across the capacitor in polar form. ii) Draw the phasor diagram relationship of Vc and Vs. iii) Is this circuit pre-dominantly inductive or capacitive? Why?arrow_forward3 Determine the voltage across the inductor in the circuit shown in Figure P4.63. 3 mH Vz(f) Vs(f) = 24 cos(1,000?) E wwarrow_forwardThe current waveform shown in Figure P4.23 flowsthrough a 2-H inductor. Plot the inductor voltage vL(t).arrow_forward
- The initial voltage across the capacitor shown in Figure P4.3 is v C ( 0+ )=0. Find an expression for the voltage across the capacitor as a function of time, and sketch to scale versus timearrow_forwardP4.11. We know that the capacitor shown in Figure P4.11 O is charged to a voltage of 10 V prior to t a. Find expressions for the voltage across the capacitor vc(t) and the voltage across the resistor vR(t) for all time. b. Find an expression for the power delivered to the resistor. c. Integrate the power from t = 0 to t = ∞ to find the energy delivered. 0. d. Show that the energy delivered to the resistor is equal to the energy stored in the capacitor prior to t = 0. t = 0 R = 100 N 100 μF UR(1)arrow_forward4.4 25 25. A capacitor (0.02 F) is charged to 1 V and then connected in series with an inductor (10 H) and a resistor (40 S2). Ini- tially, there is no current in the circuit. Find the amplitude, frequency, and phase of the charge on the capacitor and plot its graph.arrow_forward
- Please do the last question. Stated construct a graph of time versus current and voltage across the inductor. The graph is computerized. Will get a like.arrow_forwarda. As capacitor charges, describe the behavior of: i.current with time ii. the voltage across the resistor with time iii. capacitor voltage withtime Explain the reason for each behavior.arrow_forwardConsider the circuit shown in Figure P4.40. A voltmeter (VM) is connected across the inductance. The switch has been closed for a long time. When the switch is opened, an arc appears across the switch contacts. Explain why. Assuming an ideal switch and inductor, what voltage appears across the inductor when the switch is opened? What could happen to the voltmeter when the switch opens?arrow_forward
 Introductory Circuit Analysis (13th Edition)Electrical EngineeringISBN:9780133923605Author:Robert L. BoylestadPublisher:PEARSON
 Delmar's Standard Textbook Of ElectricityElectrical EngineeringISBN:9781337900348Author:Stephen L. HermanPublisher:Cengage Learning
 Programmable Logic ControllersElectrical EngineeringISBN:9780073373843Author:Frank D. PetruzellaPublisher:McGraw-Hill Education
 Fundamentals of Electric CircuitsElectrical EngineeringISBN:9780078028229Author:Charles K Alexander, Matthew SadikuPublisher:McGraw-Hill Education
 Electric Circuits. (11th Edition)Electrical EngineeringISBN:9780134746968Author:James W. Nilsson, Susan RiedelPublisher:PEARSON
 Engineering ElectromagneticsElectrical EngineeringISBN:9780078028151Author:Hayt, William H. (william Hart), Jr, BUCK, John A.Publisher:Mcgraw-hill Education,