Concept explainers
Videos
Interpretation of Regression Results: Multiple Choice
Cortez Company is planning to introduce a new product that will sell for $96 per unit. The following

Manufacturing
Required
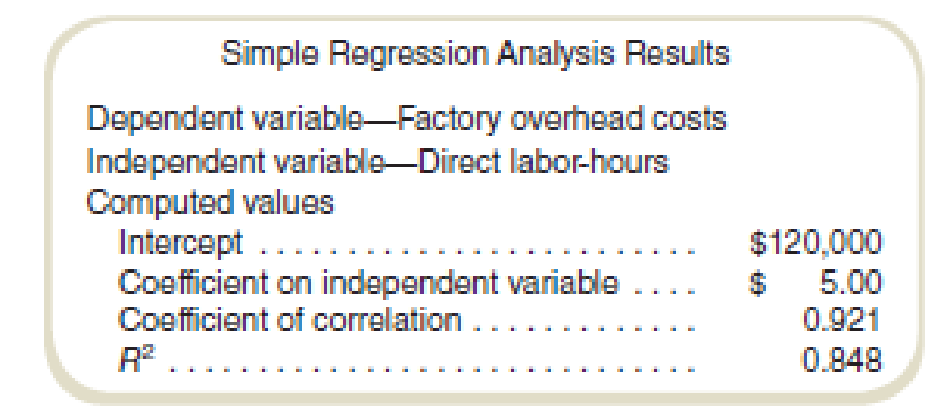
- a. What percentage of the variation in overhead costs is explained by the independent variable?
- (1) 84.8%.
- (2) 45.0%.
- (3) 92.1%.
- (4) 8.48%.
- (5) Some other amount.
- b. What is the total overhead cost for an estimated activity level of 50,000 direct labor-hours?
- (1) $120,000.
- (2) $370,000.
- (3) $250,000.
- (4) $320,000.
- (5) Some other amount.
- c. How much is the variable manufacturing cost per unit, using the variable overhead estimated by the regression (assuming that direct materials and direct labor are variable costs)?
- (1) $88.00.
- (2) $82.00.
- (3) $86.80.
- (4) $72.00.
- (5) Some other amount.
- d. What is the expected contribution margin per unit to be earned during the first year on 20,000 units of the new product? (Assume that all marketing and administrative costs are fixed.)
- (1) $96.00
- (2) $24.00
- (3) $56.00
- (4) $14.00
- (5) Some other amount.
- e. What is the manufacturing cost equation implied by these results?
- (1) Total cost = $640,000 + ($5.00 × Number of units).
- (2) Total cost = $120,000 + ($86.80 × Number of units).
- (3) Total cost = $120,000 + ($72.00 × Number of units).
- (4) Some other equation.
a.
Identify the appropriate answer for the given statement from the given choices.
Answer to Problem 45E
Option (1) The percentage of the variation in overhead costs is 84.8%.
Explanation of Solution
Regression analysis:
Regression analysis is used to show the relationship between the cost and the activity. It is used to estimate the cost at various level of activity.
The most important step in the calculation of regression analysis is to establish a logical relationship between the cost and the activity. The activity (independent variable) is placed on the right-hand side and the cost (dependent variable) is placed on the left-hand side of the graph.
Percentage of the variation in overhead costs is explained by the independent variable:
The percentage of the variation in overhead costs is 84.8% as per the value of R2.
Justification for the correct and incorrect answer:
(1)
84.8%: This is the correct figure as the value is equal to the value of R2.
(2)
45.0%: This is an incorrect figure as the value is not matching with the value of R2.
(3)
92.1%: This is an incorrect figure as the value is not matching with the correct value of 84.8%.
(4)
$14.00: This is an incorrect figure as the value is not matching with the value of R2.
(5)
Some other amount: This is an incorrect option as the value is 84.8% is given above in the option.
b.
Identify the appropriate answer for the given statement from the given choices.
Answer to Problem 45E
Option (2) The total overhead cost is $370,000.
Explanation of Solution
Total overhead cost:
Total overhead cost is the total cost of the given overhead. It consists of fixed cost and variable cost.
Calculate the total overhead cost:
Thus, the total overhead cost is $370,000.
Justification for the correct and incorrect answer:
(1)
$120,000: This is an incorrect figure as it is not matching with the total overhead cost of $370,000.
(2)
$370,000: This is the correct figure as the total overhead cost is $370,000.
(3)
$250,000: This is an incorrect figure as the value is not matching with the correct value of $370,000.
(4)
$320,000: This is an incorrect figure as the value of total overhead cost is $370,000
(5)
Some other amount: This is an incorrect option as the value is $370,000 is given in the above options.
c.
Identify the appropriate answer for the given statement from the given choices.
Answer to Problem 45E
Option (2) The variable manufacturing cost per unit is $82.
Explanation of Solution
Variable manufacturing cost:
Variable manufacturing cost is the cost of production that varies with the change in the volume of the production.
Calculate the variable manufacturing cost per unit:
Thus, the variable manufacturing cost is $82.
Working note 1:
Calculate the labor cost per unit:
Working note 2:
Calculate the total labor hours:

Justification for the correct and incorrect answer:
(1)
$88.00: This is incorrect figure is not as per the above calculation of 40,000 direct hours.
(2)
$82.00: This is the correct figure as the figure is matching with the calculated figure of $82
(3)
$86.60: This is an incorrect figure as the value is not matching with the correct value of $82.
(4)
$72.00: This is an incorrect figure as the value is $82.00.
(5)
Some other amount: This is an incorrect option as the value is $82.00 is given above option.
d.
Identify the appropriate answer for the given statement from the given choices.
Answer to Problem 45E
Option (4). The expected contribution margin is $14.00.
Explanation of Solution
Contribution margin:
The surplus of sales price over the variable expenses is known as the contribution margin. It is computed by deducting the variable expenses from the sales revenue. The contribution margin income statement is made to record the contribution margin.
Calculate the estimated contribution margin:
Thus, the estimated contribution margin is $14.
Justification for the correct and incorrect answer:
(1)
$96.00: This is an incorrect figure as it is not as per the above-calculated value of $14.
(2)
$24.00: This is an incorrect figure as per the figure is not matching the calculated figure of $14.
(3)
$56.00: This is an incorrect figure as the value is not matching with the correct value of above-calculated figure $56.
(4)
$14.00: This is the correct figure as per the above calculation.
(5)
Some other amount: This is an incorrect option as the value is $14 is given in the above options.
e.
Identify the appropriate answer for the given statement from the given choices.
Answer to Problem 45E
Option (4) The manufacturing cost equation is:
Explanation of Solution
Cost equation:
Cost equation is a mathematical representation of the cost estimation at various level of activity. It is used by defining the fixed cost, and variable cost per unit. The variable cost per unit is multiplied by the given variable to calculate the relative cost.
Calculate the manufacturing cost equation:
Thus, the manufacturing cost equation is:
Justification for the correct and incorrect answer:
(1)
(2)
(3)
(4)
Some other equation: This is the correct figure as the correct answer is not given in any of the above options.
Want to see more full solutions like this?
Chapter 5 Solutions
Fundamentals Of Cost Accounting (6th Edition)


- The president of a small manufacturing firm is concerned about the continual increase in manufacturing costs over the past several years. The following figures provide a time series of the cost per unit for the firms leading product over the past eight years: a. Construct a time series plot. What type of pattern exists in the data? b. Use simple linear regression analysis to find the parameters for the line that minimizes MSE for this time series. c. What is the average cost increase that the firm has been realizing per year? d. Compute an estimate of the cost/unit for next year.arrow_forwardUsing the information in the previous exercises about Marleys Manufacturing, determine the operating income for department B, assuming department A sold department B 1,000 units during the month and department A reduces the selling price to the market price.arrow_forwardJensen Tire Auto is deciding whether to purchase a maintenance contract for its new computer wheel alignment and balancing machine. Managers feel that maintenance expense should be related to usage, and they collected the following information on weekly usage (hours) and annual maintenance expense (in hundreds of dollars). a. Develop a scatter chart with weekly usage hours as the independent variable. What does the scatter chart indicate about the relationship between weekly usage and annual maintenance expense? b. Use the data to develop an estimated regression equation that could be used to predict the annual maintenance expense for a given number of hours of weekly usage. What is the estimated regression model? c. Test whether each of the regression parameters 0 and 1 is equal to zero at a 0.05 level of significance. What are the correct interpretations of the estimated regression parameters? Are these interpretations reasonable? d. How much of the variation in the sample values of annual maintenance expense does the model you estimated in part (b) explain? e. If the maintenance contract costs 3,000 per year, would you recommend purchasing it? Why or why not?arrow_forward
- Using Regression to Calculate Fixed Cost, Calculate the Variable Rate, Construct a Cost Formula, and Determine Budgeted Cost Refer to the information for Pizza Vesuvio on the previous page. Coefficients shown by a regression program for Pizza Vesuvios data are: Required: Use the results of regression to make the following calculations: 1. Calculate the fixed cost of labor and the variable rate per employee hour. 2. Construct the cost formula for total labor cost. 3. Calculate the budgeted cost for next month, assuming that 675 employee hours are budgeted. (Note: Round answers to the nearest dollar.) Use the following information for Brief Exercises 3-17 through 3-20: Pizza Vesuvio makes specialty pizzas. Data for the past 8 months were collected:arrow_forwardUchdorf Manufacturing just completed a study of its purchasing activity with the objective of improving its efficiency. The driver for the activity is number of purchase orders. The following data pertain to the activity for the most recent year: Activity supply: five purchasing agents capable of processing 2,400 orders per year (12,000 orders) Purchasing agent cost (salary): 45,600 per year Actual usage: 10,600 orders per year Value-added quantity: 7,000 orders per year Required: 1. Calculate the volume variance and explain its significance. 2. Calculate the unused capacity variance and explain its use. 3. What if the actual usage drops to 9,000 orders? What effect will this have on capacity management? What will be the level of spending reduction if the value-added standard is met?arrow_forwardScattergraph, High-Low Method, and Predicting Cost for a Different Time Period from the One Used to Develop a Cost Formula Refer to the information for Farnsworth Company on the previous page. Required: 1. Prepare a scattergraph based on the 10 months of data. Does the relationship appear to be linear? 2. Using the high-low method, prepare a cost formula for the receiving activity. Using this formula, what is the predicted cost of receiving for a month in which 1,450 receiving orders are processed? 3. Prepare a cost formula for the receiving activity for a quarter. Based on this formula, what is the predicted cost of receiving for a quarter in which 4,650 receiving orders are anticipated? Prepare a cost formula for the receiving activity for a year. Based on this formula, what is the predicted cost of receiving for a year in which 18,000 receiving orders are anticipated? Use the following information for Problems 3-60 and 3-61: Farnsworth Company has gathered data on its overhead activities and associated costs for the past 10 months. Tracy Heppler, a member of the controllers department, has convinced management that overhead costs can be better estimated and controlled if the fixed and variable components of each overhead activity are known. One such activity is receiving raw materials (unloading incoming goods, counting goods, and inspecting goods), which she believes is driven by the number of receiving orders. Ten months of data have been gathered for the receiving activity and are as follows:arrow_forward
- Income Statements under Absorption and Variable Costing In the coming year, Kalling Company expects to sell 28,700 units at 32 each. Kallings controller provided the following information for the coming year: Required: 1. Calculate the cost of one unit of product under absorption costing. 2. Calculate the cost of one unit of product under variable costing. 3. Calculate operating income under absorption costing for next year. 4. Calculate operating income under variable costing for next year.arrow_forwardThe cost data for Evencoat Paint for the year 2019 is as follows: Using the high-low method, express the companys maintenance costs as an equation where x represents the gallons of paint produced. Then estimate the fixed and variable costs. Predict the maintenance costs i190,000 gallons of paint are produced. Predict the maintenance costs if 81,000 gallons of paint are produced. Using Excel, create a scatter graph of the cost data and explain the relationship between gallons of paint produced and equipment maintenance expenses.arrow_forwardMethod of Least Squares, Predicting Cost for Different Time Periods from the One Used to Develop a Cost Formula Refer to the information for Farnsworth Company on the previous page. However, assume that Tracy has used the method of least squares on the receiving data and has gotten the following results: Required: 1. Using the results from the method of least squares, prepare a cost formula for the receiving activity. 2. Using the formula from Requirement 1, what is the predicted cost of receiving for a month in which 1,450 receiving orders are processed? (Note: Round your answer to the nearest dollar.) 3. Prepare a cost formula for the receiving activity for a quarter. Based on this formula, what is the predicted cost of receiving for a quarter in which 4,650 receiving orders are anticipated? Prepare a cost formula for the receiving activity for a year. Based on this formula, what is the predicted cost of receiving for a year in which 18,000 receiving orders are anticipated?arrow_forward
- Bolger and Co. manufactures large gaskets for the turbine industry. Bolgers per-unit sales price and variable costs for the current year are as follows: Bolgers total fixed costs aggregate to 360,000. Bolgers labor agreement is expiring at the end of the year, and management is concerned about the effects of a new labor agreement on its break-even point in units. The controller performed a sensitivity analysis to ascertain the estimated effect of a 10-per-unit direct labor increase and a 10,000 reduction in fixed costs. Based on these data, the break-even point would: a. decrease by 1,000 units. b. decrease by 125 units. c. increase by 375 units. d. increase by 500 units.arrow_forwardUsing High-Low to Calculate Predicted Total Variable Cost and Total Cost for a Time Period That Differs from the Data Period Refer to the information for Pizza Vesuvio on the previous page. Assume that this information was used to construct the following formula for monthly labor cost. TotalLaborCost=5,237+(7.40EmployeeHours) Required: Assume that 4,000 employee hours are budgeted for the coming year. Use the total labor cost formula to make the following calculations: 1. Calculate total variable labor cost for the year. 2. Calculate total fixed labor cost for the year. 3. Calculate total labor cost for the coming year. Use the following information for Brief Exercises 3-17 through 3-20: Pizza Vesuvio makes specialty pizzas. Data for the past 8 months were collected:arrow_forwardProtest Industries produces only one product. The following revenues and cost have been estimated for the forthcoming month: Selling price, $ 117 per unit (SP) Variable cost, $ 78 per unit (VC) Fixed Cost, $ 78,000 A) The managers of the firm wish to know the following: Calculate contribution margin per unit Calculate contribution margin ratio. BEP in units and Dollars Calculate margin of safety if actual sales are 6,000 units Prepare a Break-even chart using above information Calculate how many units must be sold to get a profit of $156,000. (B) Make or buy Decision (4 marks) Consider the following scenarios for Decision Making: Sparks Ltd produces three products: A, B and C. The following is an estimate of costs and revenue for the forthcoming year: A B C $ $ $ Sales 41,000…arrow_forward
 Essentials of Business Analytics (MindTap Course ...StatisticsISBN:9781305627734Author:Jeffrey D. Camm, James J. Cochran, Michael J. Fry, Jeffrey W. Ohlmann, David R. AndersonPublisher:Cengage Learning
 Excel Applications for Accounting PrinciplesAccountingISBN:9781111581565Author:Gaylord N. SmithPublisher:Cengage Learning
 Managerial Accounting: The Cornerstone of Busines...AccountingISBN:9781337115773Author:Maryanne M. Mowen, Don R. Hansen, Dan L. HeitgerPublisher:Cengage Learning
 Principles of Accounting Volume 2AccountingISBN:9781947172609Author:OpenStaxPublisher:OpenStax College
 Financial And Managerial AccountingAccountingISBN:9781337902663Author:WARREN, Carl S.Publisher:Cengage Learning,
 Managerial AccountingAccountingISBN:9781337912020Author:Carl Warren, Ph.d. Cma William B. TaylerPublisher:South-Western College Pub