
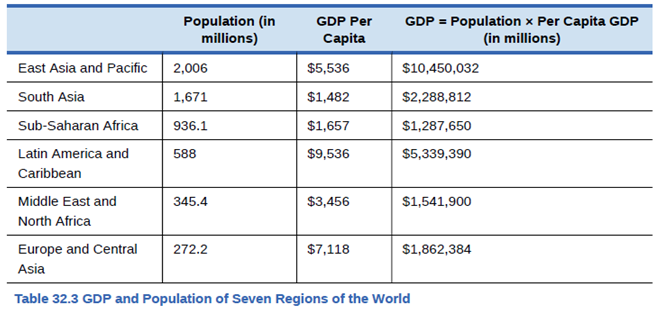
Using the data in Table 32.3, rank the seven regions of the world according to
The rank:
The given regions of the world according to the GDP and then according to the GDP per capita
Explanation of Solution
As per the table given, the rankings are as follows:
| Countries | Population
|
GDP per capita
|
Ranking as GDP | |
| East Asia and Pacific | I | |||
| Latin America and Caribbean | II | |||
| South Asia | III | |||
| Europe and Central Asia | IV | |||
| Middle East and North Africa | V | |||
| Sub-Saharan Asia | VI |
| Countries | Population
|
GDP per capita
|
Ranking as GDP per capita | |
| Latin America and Caribbean | I | |||
| Europe and Central Asia | II | |||
| East Asia and Pacific | III | |||
| Middle East and North Africa | IV | |||
| Sub-Saharan Asia | V | |||
| South Asia | VI |
Economist measures a nation’s standard of living through its GDP per capita. GDP measures annual economic output that is total value of goods and services produced within a country.
The low-income countries are those which are having GDP per capita income less than
Want to see more full solutions like this?
Chapter 32 Solutions
Principles of Economics 2e
Additional Business Textbook Solutions
Horngren's Accounting (11th Edition)
Financial Accounting (12th Edition) (What's New in Accounting)
Managerial Accounting (4th Edition)
Managerial Accounting (5th Edition)
Construction Accounting And Financial Management (4th Edition)
Horngren's Accounting (12th Edition)

- 1960 South Korea Mexico 2012 South Korea Mexico Population, total (in millions) 25 38.7 50 120.8 e GDP (in billions of constant 2005 US$) 27.7 127.6 1165.3 1031.1 Source: World Development Indicators. Calculate per capita GDP for each country and year. Don't use commas or dollar signs, and round to the nearest dollar. • South Korea, 1960: 1108 • Mexico, 1960: type your answer... • South Korea: 2012: 23306 • Mexico, 2012: type your answer... • Did the standard of living rise in both countries? (type either yes or no): type your answer... • Which country saw the greater increase in living standards? type your answer... According to the PPF model, why might this country have had a greater increase in living standards? (Type the letter that corresponds to the best answer.) a. This country created more capital. b. This country's population increased more. c. This country adopted more advanced tecnhology. d. All of the above are consistent with the PPF model and the data. e. (a) and (c) only…arrow_forwardConsider the following data for country A: Population (millions) Real GDP Country ($ billions) 50 A Calculate per capita real GDP (Enter your response rounded to the nearest integer.) Suppose that during the next 10 years, real GDP triples and population doubles in country A. What will per capita real GDP after 10 years have passed? (Enter your response rounded to the nearest integer.) $.arrow_forwardWhat is GDP per capita and why is it useful in measuring differences in living standards between different countries?arrow_forward
- Please explain correctly. Economics According to the 2016 Human Development Report (see pp. 198-201), Pakistan fares more poorly in the HDI ranking (148) than in the GNI per capita (PPP US$) ranking (138). Argentina fares better in the HDI ranking (45) than GDP per capita (57). Are these results surprising? How would you explain the discrepancy in the rankings?arrow_forwardRetrieve the following data from The World Bank database (http //databank.worldbank. org/data/ home.aspx) for India, Spain, and South Africa for the most recent year available: • GDP in constant international dollars or PPP • Population • GOP per person in constant international dollars • Mortality rate, infant (per 1,000 live births) • Health expenditure per capita (current U.S. dollars) • Life expectancy at birth, total (years)arrow_forwardIn your opinion, will real GDP or per capita real GDP be a better indicator in measuring well-being of a nation?arrow_forward
- Explain why GDP per capita comparison among nations are not a perfect measure of differences in economic well-being. (Hint: there are four problems with using GDP per capita to compare rich versus poor countries)arrow_forwardThe following table shows the GDP per capita since 1820 in selectedcountries (in PPP-adjusted 2005 dollars). 1. Identify the countries that experienced catch-up growth from 1920 to2010.arrow_forwardAccording to Figure 15.4, by what percentage did GDP per capita increase between 1820 and 1995 in North America? Latin America? Africa?arrow_forward
 Principles of Economics 2eEconomicsISBN:9781947172364Author:Steven A. Greenlaw; David ShapiroPublisher:OpenStax


