
Table 22.4 shows the fruit
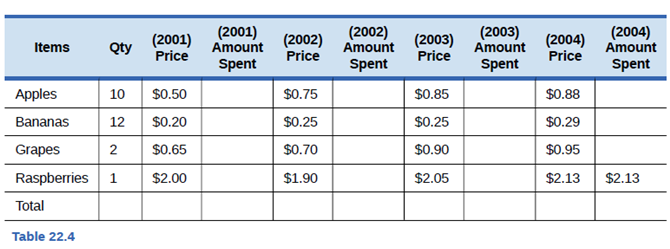
The amount spent on the “basket” i.e. combination of different fruits, every year.
Explanation of Solution
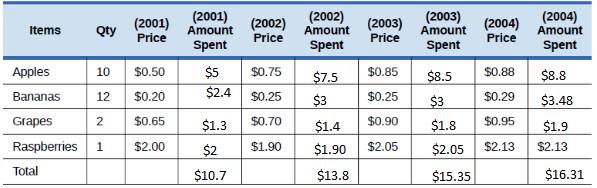
The Price of a Basket of Goods: To determine the level of price for commodities, Economists discovered a new concept of a basket of goods and services, which consists of different types of commodities that an individual, businesses or organizations often buy. This concept looks at how the prices of commodities changed over time.
Want to see more full solutions like this?
Chapter 22 Solutions
Principles of Economics 2e
Additional Business Textbook Solutions
Managerial Accounting (4th Edition)
Financial Accounting (12th Edition) (What's New in Accounting)
Cost Accounting (15th Edition)
Principles of Accounting Volume 2
Principles of Accounting Volume 1

- Go to this website (http://www.measuringworth.com/ppowerus/) for the Purchasing Power Calculator at measuringWorth.com. How much money would it take today to purchase what one dollar would have bought in the year of your birth?arrow_forwardSuppose seafood price and quantity data for the years 2000 and 2009 follow. Use 2000 as the base period.Seafood 2000 Qty. (lb) | 2000 Price ($/lb) | 2009 Price ($/lb)Halibut 75,090 1.91 2.33Lobster 83,080 3.72 3.09Tuna 50,779 1.87 1.97(a)Compute a price relative for each type of seafood. (Round your answers to one decimal place.)Seafood Price RelativeHalibut 122.0 Lobster _________ Tuna 105.3 (b)Compute a weighted aggregate price index for the seafood catch. (Round your answer to one decimal place.)I2009 = ___________ Comment on the change in seafood prices over the nine-year period. (Enter your percentage as a positive value. Round your answer to one decimal place.)Seafood prices have decreased by ______ % over the 9-year period according to the index.arrow_forwardConsider that the quantity of Milk A sold will increase by 50%, the sales revenue of Milk A will decrease by 25%, and the price is determined by sales revenue divided by quantity sold. Which of the following best describes the expected change in Milk A's price in April, compared to March? January February March Milk A Quantity Sold Sales Revenue Quantity Sold 500 800 400 $3,000 $4,400 $2,400 Milk B 1200 1500 950 Select the single best answer: A. increase by 25% B. decrease by 50% C. decrease by 25% D. decrease by 15% E. no change Sales Revenue $5,000 $6,000 $4,400 Quantity Sold Milk C 600 550 700 Sales Revenue $3,400 $3,300 $5,000arrow_forward
- What is the trend in hours?arrow_forwardAssume that the top 3 yearly purchases of the average college student are: Gel ink pens (10 pens), energy drinks (200 cans), and Hydro Flask water bottles (1). Calculate the cost of the basket in each year. Year Price of Price of Price of pens Hydro Flask 2015 $2.00 2016 $2.85 2017 $2.90 2018 $3.00 energy drinks Answer: 1.90 1.90 1.95 2.00 35 40 45 55 What is the cost of the basket in 2016? Cost of Basketarrow_forwardWrite the quantity equation and explain it.arrow_forward
- Quantity of Subscriptions to Economics Statistics Quantity of Subscriptions to Office Productivity Apps per Year 1. Total Utility (utils) Apps per Year Total Utility (utils) 30 1 600 1,100 1,500 2 50 3 60 4 68 4 1,800 2,000 2,100 72 75 Refer to the above table and assume that each year this consumer buys only annual subscriptions to economics statistics apps and subscriptions to office productivity apps. The price of a subscription to each type of economics statistics app is $2, and the subscription to each office productivity app is $60 per year. If the consumer's available income is $64 per year, the consumer will purchase economics statistics app(s) andoffice productivity app(e). if the consumer's available income rises to $246, what will be the new combination of economics statistics apps and office productivity apps? economics statistics app(s): and office productivity app(s):arrow_forwardYou can tell by the sign preceding the price of Ronova tablets (Pr) that Grapple and Ronova are:arrow_forwardExamine the following information as reported for the foods below in the years 2010 and 2019. 2010 2019 Item Price (S) Quantity Price (S) Quantity Eggs (one dozen) $2.75 27 $3.37 40 Chicken (500 g) $3.20 11 $3.57 7 Bread (675 g) $2.28 18 $2.83 23 a) Compute a simple price index for each of the items, using the year 2010 as the base year. Enter them in the same order as above: Eggs, Chicken, Bread. Round answers to 1 decimal. b) Compute a simple aggregate price index. Use 2010 as the base period. Round to one decimal place. c) Compute the Laspeyres price index for 2019 using 2010 as the base year. Round to one decimal place. d) Determine a value index for 2019, using 2010 as the base year. Round to one decimal place.arrow_forward
- Which of the graph/s below show/s a rise in the price of chicken? Fish (pounds per year) Fish (pounds per year) Chicken (pounds per year) Figure B Chicken (pounds per year) Figure A Fish (pounds per year) Fish (pounds per year) Chicken (pounds per year) Chicken (pounds per year) Figure C Figure D Figure A Figure B Figure C Figure D Figures C and Darrow_forwardwhich grpah is the correct graph for part 2arrow_forwardCalculate TR, MR and AR. Price () 4 7 Units sold 1 3 4arrow_forward
 Principles of Economics 2eEconomicsISBN:9781947172364Author:Steven A. Greenlaw; David ShapiroPublisher:OpenStax