please draw me the graph if possible. Picking a Quality Level Suppose dwelling quality is measured on a scale of 1 to 10, and the monthly cost of producing a particular quality equals the square of the quality level: For quality level 1, the cost is $1; for quality level 2, the cost is $4, and so on. The monthly rent equals the price per unit of quality 4. Picking a Quality Level Suppose dwelling quality is measured on a scale of 1 to 10, and the monthly cost of producing a particular quality equals the square of the quality level: For quality level 1, the cost is $1; for quality level 2, the cost is $4, and so on. The monthly rent equals the price per unit of quality (P = $9) times the quality level. Total revenue Total cost Quality of dwelling Marginal cost Marginal revenue Quality of dwelling Owner's objective is to maximize profit, the gap between total revenue and total cost. Profit is maximized at the quality level where the marginal benefit (the price of quality) equals the marginal cost: q*. a. Use a two-panel graph as the above figure to show the profit-maximizing quality level. b. At the profit maximizing quantity of marginal cost equals
please draw me the graph if possible. Picking a Quality Level Suppose dwelling quality is measured on a scale of 1 to 10, and the monthly cost of producing a particular quality equals the square of the quality level: For quality level 1, the cost is $1; for quality level 2, the cost is $4, and so on. The monthly rent equals the price per unit of quality 4. Picking a Quality Level Suppose dwelling quality is measured on a scale of 1 to 10, and the monthly cost of producing a particular quality equals the square of the quality level: For quality level 1, the cost is $1; for quality level 2, the cost is $4, and so on. The monthly rent equals the price per unit of quality (P = $9) times the quality level. Total revenue Total cost Quality of dwelling Marginal cost Marginal revenue Quality of dwelling Owner's objective is to maximize profit, the gap between total revenue and total cost. Profit is maximized at the quality level where the marginal benefit (the price of quality) equals the marginal cost: q*. a. Use a two-panel graph as the above figure to show the profit-maximizing quality level. b. At the profit maximizing quantity of marginal cost equals

Chapter17: Income, Poverty, And Health Care
Section: Chapter Questions
Problem 8P

Related questions
Question
Note: use of chat gpt is strictly prohibited..
Transcribed Image Text:please draw me the graph if possible. Picking a Quality Level Suppose dwelling quality is measured on a
scale of 1 to 10, and the monthly cost of producing a particular quality equals the square of the quality
level: For quality level 1, the cost is $1; for quality level 2, the cost is $4, and so on. The monthly rent
equals the price per unit of quality
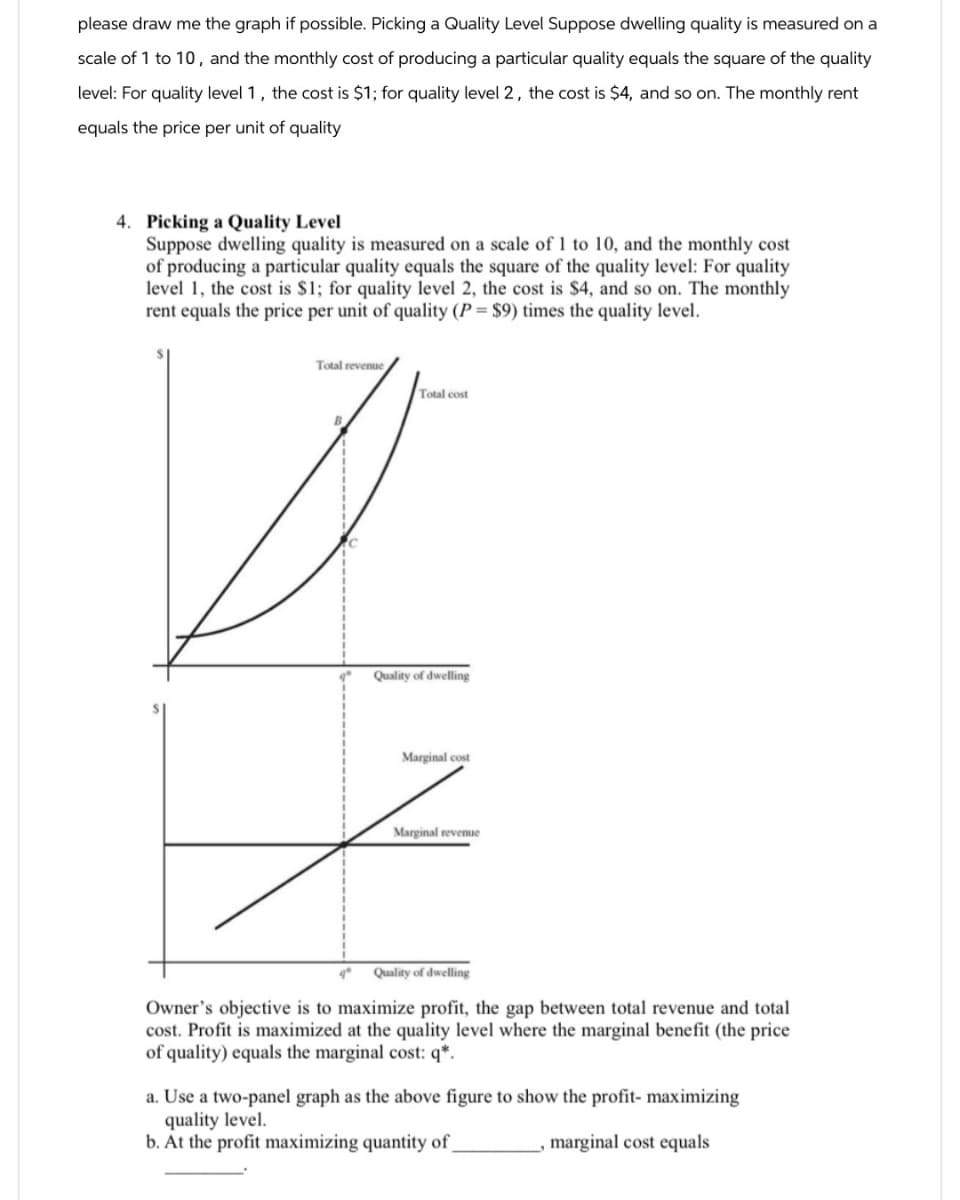
4. Picking a Quality Level
Suppose dwelling quality is measured on a scale of 1 to 10, and the monthly cost
of producing a particular quality equals the square of the quality level: For quality
level 1, the cost is $1; for quality level 2, the cost is $4, and so on. The monthly
rent equals the price per unit of quality (P = $9) times the quality level.
Total revenue
Total cost
Quality of dwelling
Marginal cost
Marginal revenue
Quality of dwelling
Owner's objective is to maximize profit, the gap between total revenue and total
cost. Profit is maximized at the quality level where the marginal benefit (the price
of quality) equals the marginal cost: q*.
a. Use a two-panel graph as the above figure to show the profit-maximizing
quality level.
b. At the profit maximizing quantity of
marginal cost equals
Expert Solution
This question has been solved!
Explore an expertly crafted, step-by-step solution for a thorough understanding of key concepts.

This is a popular solution!

Trending now
This is a popular solution!

Step by step
Solved in 2 steps with 1 images

Recommended textbooks for you
Exploring Economics
Economics
ISBN:
9781544336329
Author:
Robert L. Sexton
Publisher:
SAGE Publications, Inc

Principles of Economics 2e
Economics
ISBN:
9781947172364
Author:
Steven A. Greenlaw; David Shapiro
Publisher:
OpenStax
Exploring Economics
Economics
ISBN:
9781544336329
Author:
Robert L. Sexton
Publisher:
SAGE Publications, Inc
Principles of Economics 2e
Economics
ISBN:
9781947172364
Author:
Steven A. Greenlaw; David Shapiro
Publisher:
OpenStax